

AI-generated — show prompt
A dark moody digital illustration of a 4K video rendering pipeline with large pixel frames moving between a CPU, GPU and encoder. Duplicate frames and redundant transfer arrows fade away, while a compact title layer, a blurred background and satellite-map tiles join the remaining path. Color palette: deep navy (#101218), electric blue (#468CDC), warm amber for expensive operations. Technical illustration style, slightly stylized, 16:9 landscape, dark background suitable for text overlay, no readable labels, leave clear space above the pipeline.
On October 1 a control run on my M5 took 39 minutes to render a ten-minute 4K HDR film. My note to Codex was fairly relaxed about it: “Video assembly is still a bit long but it’s 4k hdr . Create an issue to see if we can improve the rendering speed”.
Two days later, a 68.5-second 4K HDR benchmark film rendered 3.6× faster on my M2, and every machine I tested took 40% to 72% less time, Linux GPUs included:
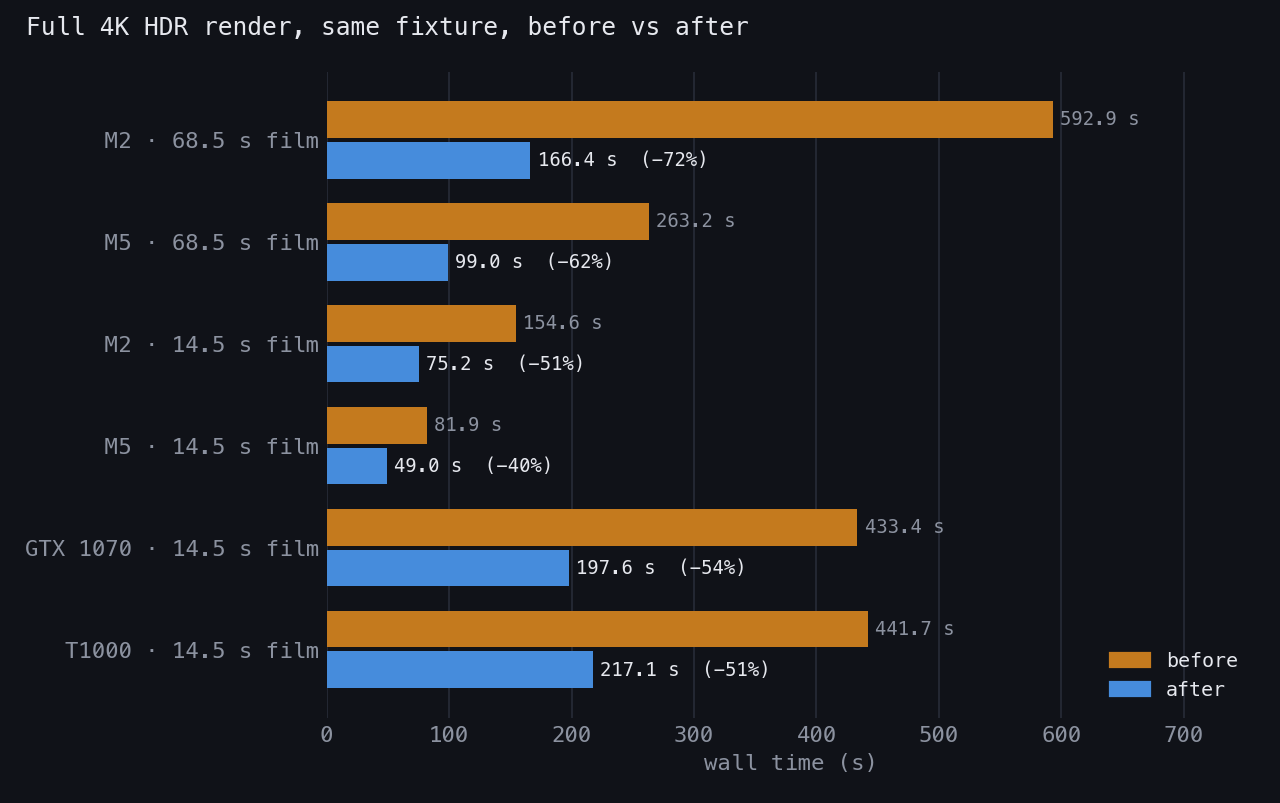
Almost none of it came from making anything faster. It came from not doing work: not converting the same frame twice, not blurring pixels nobody sees, not resizing frames that were about to be thrown away. This is Immich Memories, my tool for turning an Immich photo library into short films, and most of this round was Codex.
Everybody thought it was the encoder
The ten-minute film’s assembly took 1,069 seconds. The phase log made the split easy to read (run IDs and file names removed):
2026-10-01 11:12:27,085 [INFO] immich_memories.progress: Streaming video assembly...
2026-10-01 11:28:00,626 [INFO] immich_memories.processing.streaming_assembler: Streaming assembly complete: 171 clips
2026-10-01 11:28:00,628 [INFO] immich_memories.progress: Mixing audio...
2026-10-01 11:28:33,854 [INFO] immich_memories.progress: Muxing final output...
2026-10-01 11:28:35,738 [INFO] immich_memories.processing.streaming_assembler: Full streaming assembly complete: 171 clips
933.5 seconds of “streaming video”, 33 of audio, 2 of muxing. And “streaming video” sounds like “encoding”, which is where everyone’s intuition goes.
That intuition had history in this project. In March, Claude looked at a slow title renderer and said, without measuring: “260ms/frame is still FFmpeg HEVC encoding being the bottleneck. The GPU renders in sub-3ms — we’re waiting 257ms for the encoder.” Switching to H.264 took it to roughly 290 ms per frame. Not the encoder. In August, an AI review of the docs found six pages still telling readers that encoding was the bottleneck, with a line I liked: “someone sizes a GPU box for the encoder and waits the same time.”
So this time the issue Codex filed started with the right sentence: “Phase wall time alone does not identify the encoder as the bottleneck”. “Streaming video” covers everything between the source file and the encoder: decoding, scaling, the blurred background, HDR colour conversion, moving raw frames through Python, crossfades, and only then encoding.
Replaying graphs into a discard sink
The method was simple and I’d steal it for any FFmpeg pipeline. Take the exact decode graph the assembler built for a clip, keep the source and the filters, and send the output to -f null. That times frame production without the encoder or the Python pipe. Then add pieces back one at a time.
Two diagnostic runs pointed straight at the filters. Removing HDR transfer conversion from one 1080p HLG blur-fill graph took it from 4.16 to 1.32 seconds. Replacing the blurred background with black in another graph took 15.8 seconds to 3.4. Neither is a fix (both change the output), but they show where the time goes.
Then Codex read the graphs, and found the order was wrong. Here’s one as the assembler built it (caption text removed):
setpts=PTS-STARTPTS,scale=2160:3840:flags=lanczos,fps=60,settb=1/60,zscale=tin=arib-std-b67:t=smpte2084:pin=bt2020:p=bt2020:min=bt2020nc:m=bt2020nc:npl=203:agamma=false,setparams=colorspace=bt2020nc:color_primaries=bt2020:color_trc=smpte2084,format=p010le,drawtext=…fps=60 comes before zscale. A 30 fps phone clip gets every frame duplicated to reach 60, and then each copy goes through the expensive HLG-to-PQ conversion. Its summary: “30 fps footage gets duplicated before colour conversion, while a 240 fps clip gets resized and blurred before most frames are discarded.”
Three changes, reproduced
I re-ran the method while writing this, on CC0 stock photos turned into synthetic clips, with graphs modelled on the production ones: 2160×3840 portrait at 60 fps, discard sink, median of three alternating runs on an M5 Max.
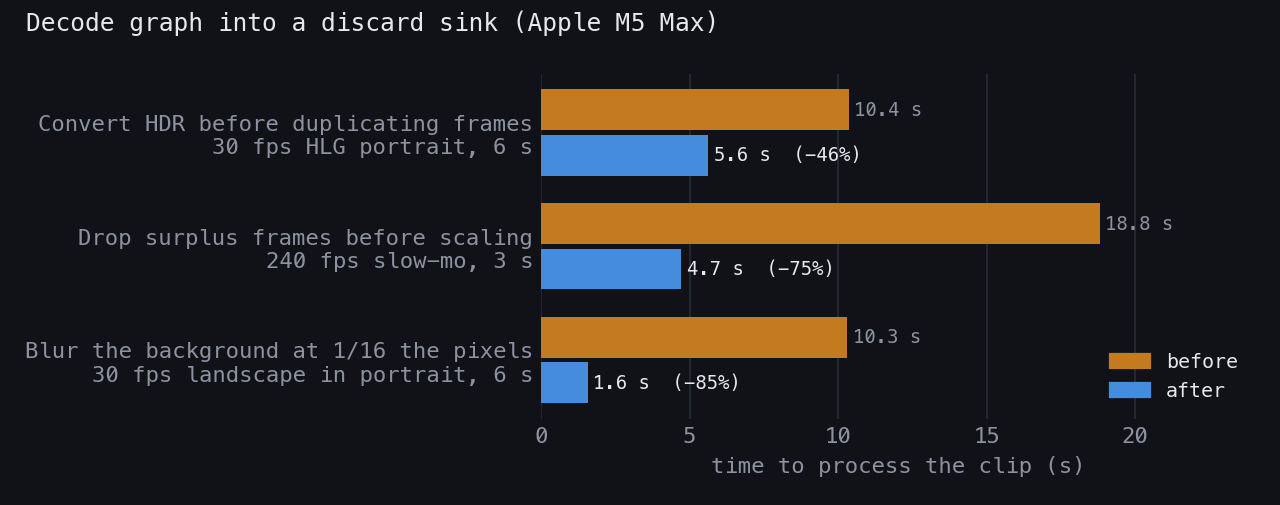
Convert before duplicating. Moving the colour conversion before fps=60 means it runs once per source frame instead of twice. The output is the same: I hashed every frame of both orders and all 120 frames and timestamps match. In the original work, two complete test assemblies went from 12.1 to 8.0 seconds and from 39.0 to 26.3, with matching frame hashes, timestamps and audio. It’s the best kind of optimisation: the proof is a diff, not a judgement call. It only applies where it’s safe (known, matching source rates below the output rate, going into the HDR path); unknown rates keep the old order.
Drop surplus frames first. The mirror image for slow-motion clips. A 240 fps source was being scaled and blurred at 240 fps, then thinned to 60. Doing fps=60 first means three out of four frames never get processed. On the benchmark fixture: M2 73.4 → 50.6 s, M5 31.8 → 22.3 s, T1000 224.3 → 143.8 s.
Blur fewer pixels. A landscape clip in a portrait film gets a blurred copy of itself as background. That blur ran at full 2160×3840. Blurring at a quarter of the width and height (one sixteenth of the pixels) and scaling up afterwards should look the same once it’s blurred with sigma 30. Unlike the first change, this one changes the sampling, so it needed visual checks rather than a hash comparison.
Colour conversion also got a fast path for tagged BT.709 SDR going into PQ, which broke CI right after merging: “CI caught a real color-accuracy failure in the SDR→PQ conversion: two Linux test patterns exceed the allowed pixel error.” The fix keeps the fast path but checks it once per process at runtime and falls back to the accurate conversion when it doesn’t hold. Blur plus SDR together, on the Linux fixture: GTX 1070 160.4 → 42.3 s, T1000 176.1 → 68.6 s.
Titles and maps: the same idea, on the GPU
The title cards are rendered with Taichi GPU kernels. In March, Claude had found the obvious-in-hindsight problem: NumPy arrays between every kernel, so each frame went GPU → CPU → GPU between operations. Keeping buffers on the GPU and fusing small operations took a 720p title frame from 35–43 ms to 2.2 ms (gradient) and 3.1 ms (photo-backed). In October the HDR interpolation and fades moved onto the GPU too: the opening title went from 48.75 to 8.81 seconds on the M2, and from 141.4 to 24.2 on the T1000.
Maps had the same shape of problem. The tile cache stored compressed bytes, so every frame re-decoded them, and the final resize ran as one big operation over a huge image. A decoded-pixel cache plus a strip resize that processes aligned strips in parallel, each keeping the global source coordinates so the seams sample identically: M2 33.1 → 20.5 s, M5 19.6 → 11.9 s.
The read-ahead that made Linux slower
Not everything that sounded faster was. Bounded read-ahead lets a decoder prepare the next frame while the encoder is still busy with the last one. On the Macs it helped: M2 21.4 → 19.5 s, M5 10.5 → 8.2 s, for about 49 MB more memory.
Codex wired it in as a default gated on memory, CPU count and frame size, which would have switched it on for Linux too, untested. It called it “the last performance change I’d include”. Then the matched Linux runs came back:
issue1760-linux-t1000-o-results {'reference': 33.85770247131586, 'candidate': 45.0270792581141}
issue1760-linux-t1000-p-results {'reference': 36.58244025707245, 'candidate': 37.945919916033745}
pooled {'reference': 35.220071364194155, 'candidate': 41.48649958707392} candidate_slower_pct 17.792207625253198
18% slower on the T1000. Giving it a fourth CPU didn’t help (31.8 → 40.4 s). The GTX 1070 was neutral. So read-ahead ships only where it was measured to help: HEVC VideoToolbox on a Mac, HD or larger, at least two CPUs and 4 GiB of known memory budget. Everything else stays synchronous. To its credit, Codex caught this with its own matched benchmark while the PR was still a draft.
More decoder threads were the same story. My question was “I have more threads than that, can’t we auto detect”, and Codex found a hard cap of four decoder threads plus CPU detection that ignored container quotas. Then it measured: eight threads weren’t faster (5.43 vs 5.47 s) and used 798 → 1,044 MB. More threads bought memory, not speed.
The baseline was missing audio
The strangest find of the round wasn’t a speedup. Comparing outputs under an 8 GiB container on Linux, Codex noticed the baseline film’s last 0.4 seconds were silent, while the candidate still had sound. The RMS per section of the final audio:
{"start": 4.5, "end": 5.8, "baseline_rms": 0.005732487887144089, "candidate_rms": 0.005732487887144089, ...}
{"start": 5.8, "end": 6.1, "baseline_rms": 0.0038722653407603502, "candidate_rms": 0.012408527545630932, ...}
{"start": 6.1, "end": 6.5, "baseline_rms": 0.0, "candidate_rms": 0.008546351455152035, ...}
Each source’s FFmpeg process writes video frames to Python and the clip’s audio to a WAV file. The assembler closed the decoder as soon as it had all the frames it wanted, even if FFmpeg hadn’t finished writing the WAV. A shutdown race that had been there all along, invisible on the Macs (an earlier Mac parity check reported all audio hashes matching). The fix waits for both outputs before yielding the last frame, and it was applied to both sides of the comparison: missing audio can’t be part of the baseline you’re trying to preserve.
Keeping the benchmarks honest
Most of the hours went into the numbers, not the code. Things that went wrong with the measurements, caught one by one:
- The title benchmarks ran on an old dirty worktree. My message: “oh no we’re still on the old dirty worktree, so it means you probably did not test the latest versions…”. Codex: “You’re right… did not validate current
main. I should have checked that first.” Redo M2 and M5. - The HLG test fixture had lost its transfer tags, so “HLG” runs weren’t HLG.
- M5 timings were contaminated by a CI job running in the background. Codex added a contention guard to the benchmark script.
- The M2 went to sleep with the lid closed, and the pauses were first read as application slowness (“I should have checked the power log before treating those pauses as application slowness”).
- FFmpeg 6.1 dropped the final frame after the blur overlay at equal rates. That one became its own correctness fix.
The final fixture: portrait 2160×3840, 60 fps, 10-bit PQ, 48 kHz stereo, with a GPU title, a map rendered from a controlled synthetic tile server (so a public tile provider’s latency doesn’t decide the result), SDR and HLG clips, captions, crossfades and muxing. Hardware encoding verified (software fallback disabled on the Macs). The samples are small (one final Mac run per length, one matched pair per Linux GPU), so the table at the top is before/after per machine, not a hardware ranking. The closeout report has the full scope.
What shipped
- HDR conversion before frame duplication, byte-identical output, about a third less time on those clips.
- Surplus frames dropped before scaling and blurring for high-frame-rate sources.
- The blurred background at one sixteenth of the pixels.
- A fast SDR→PQ path with a runtime accuracy check and an accurate fallback.
- GPU titles end to end, and maps with decoded-tile caching and parallel strip resizing.
- Read-ahead only where it was measured to help (Mac VideoToolbox), synchronous everywhere else.
- Clip audio that finishes writing before its decoder shuts down.
- The 68.5-second 4K HDR benchmark film: 592.9 → 166.4 s on M2, 263.2 → 99.0 s on M5.
What the models did, and what I did
October was Codex, with sub-agents per issue. March titles were Claude Code.
Codex did the parts I’d never have had the patience for: replaying the captured decode graphs into discard sinks, reading the graph order, alternating repeat runs, catching its own bad fixtures and its own read-ahead regression. It was also unusually careful about not over-claiming. On removing a decoder copy: “Python CPU time by about 14–15%… wall time moved only 1–2%… not a proven fix.” That change shipped for its memory saving, not as a speedup.
My job was mostly scope and stopping. When it narrowed issue #1704 to titles: “now, the issue 1704 was not ONLY about titles, right ?” (“Yes. I narrowed the work too much around titles.”). When a render was using the Linux GPU: “Gpu is used by a render btw so Linux needs to be retested . And do on both gtx 1070 and t1000”. And on October 2 at 8:51 AM, when it was hunting for the cause of a pixel difference in a map frame that nobody would ever see: “you’re looping in pixel perfect change when NOBODY CARES”, followed by “It has to be GOOD ENOUGH”. Twenty minutes later it ended its turn early and I had to push it to finish (“Create a scoped goal so we don’t lose track”).
The lesson from both rounds is the same one the March encoder claim taught me: a phase name in a log isn’t a profile. Replay the graph, time the pieces, and only then decide what’s slow.